Security overview
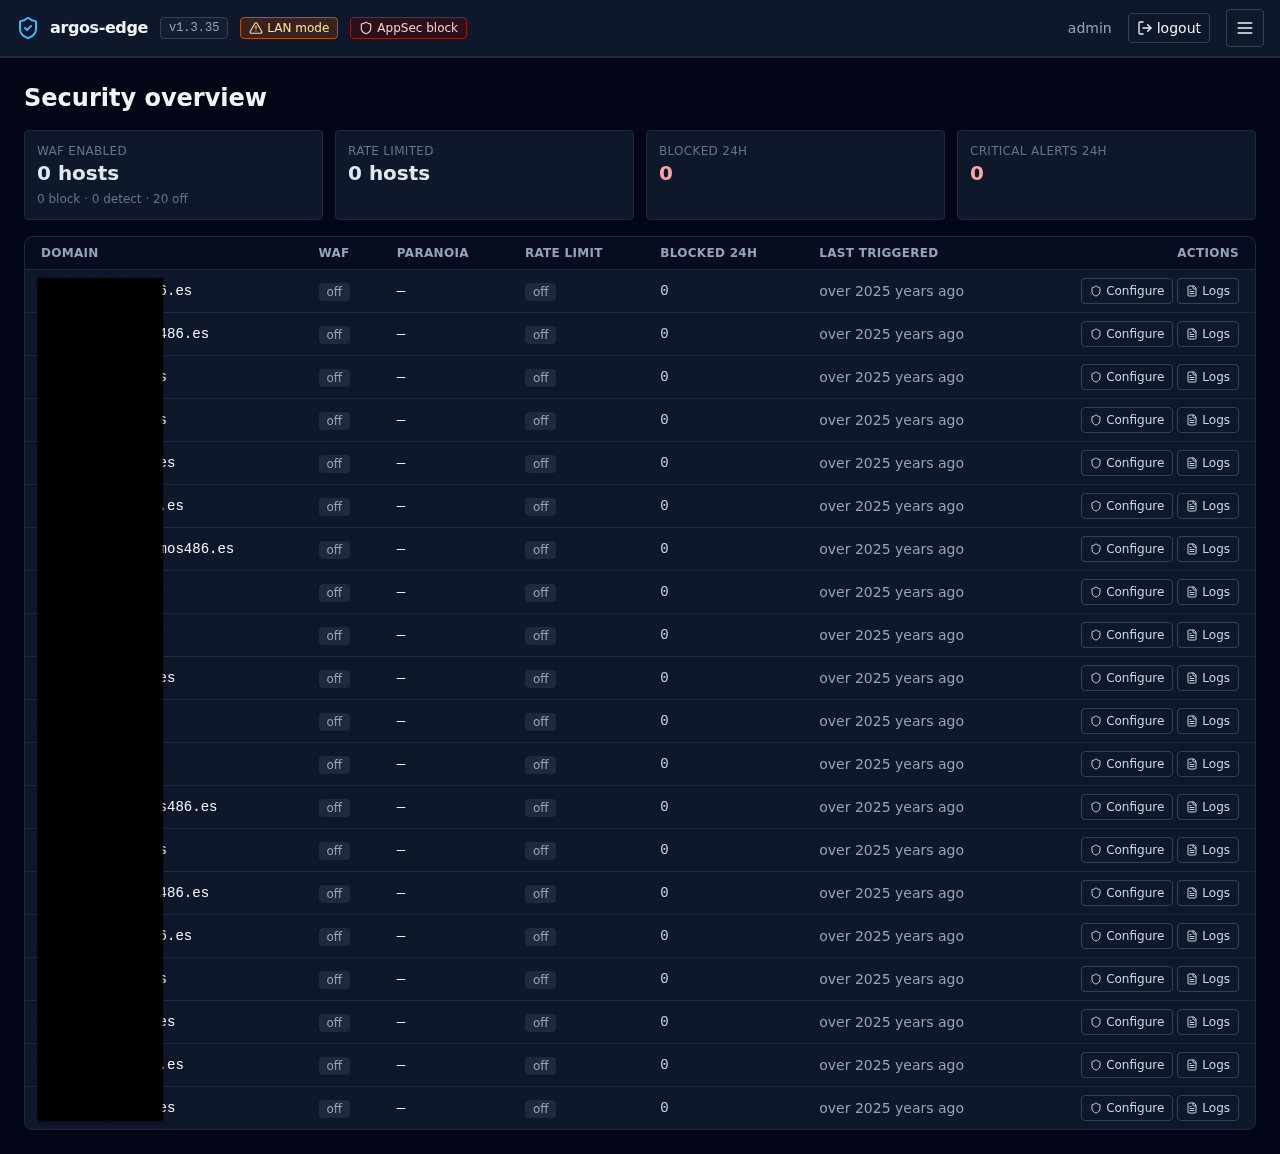
/security is the single-glance view of every host's protection posture. One card row for totals, one table row per host for per-domain state. Auto-refreshes every 30 s.
Use this page when you want to answer "is everything covered?" without clicking through hosts one by one.
The four KPI cards
Across the top, four counters aggregated over your whole host list:
| Card | Value | Source |
|---|---|---|
| WAF enabled | <block + detect> hosts with a sub-line breaking the total into <block> · <detect> · <off> | host_security.waf_enabled + waf_mode |
| Rate limited | <n> hosts with rate limiting on | host_security.rate_limit_enabled |
| Blocked 24h | Total blocked requests across all hosts in the last 24 h | WAF + rate-limit counters |
| Critical alerts 24h | Count of critical-severity events delivered through Notifications in the last 24 h | notification_deliveries |
The last two cards render in red so a non-zero number jumps out when you open the page.
Per-host table
One row per host, sorted by domain:
| Column | What it shows |
|---|---|
| Domain | The host's domain (monospace) |
| WAF | Badge: off (slate), detect (amber), block (red) |
| Paranoia | CRS paranoia level 1..4, or — when WAF is off |
| Rate limit | Badge: on (sky) / off (slate) |
| Blocked 24h | Count of blocks attributed to this host in the last 24 h |
| Last triggered | Relative timestamp of the most recent WAF / rate-limit hit. Hover for the absolute time |
| Actions | Two buttons: Configure and Logs |
- Configure jumps to
/hosts/<id>/security— the per-host security editor where you flip WAF mode, tune paranoia, set rate-limit windows, add CRS rule exclusions, and write custom SecRules. See WAF. - Logs opens
/logs?source=waf_audit&host_id=<id>— the logs browser pre-filtered to WAF audit entries for this host. See Logs browser.
Where it fits
/appseccontrols the WAF's global posture (off / detect / block). The Security overview reflects each host's per-host override of that global mode./hosts/<id>/securityis where you make changes. The overview is read-only — it points you at the host that needs attention and the logs that explain why./logsis where you drill into the specific events behind a non-zeroBlocked 24hcount.
When to open it
- Morning check: do all hosts that should have WAF enabled have it enabled? Did any slip to
offovernight? - After a deploy: new host shows up — confirm its WAF + rate-limit settings landed as intended before you take it public.
- During an incident: the
Blocked 24hcolumn tells you at a glance which host is under fire. See Respond to an attack.
Related
- WAF — Coraza / CRS internals, modes, exclusions.
- Logs browser — drill-down for the per-host
Logsaction. - Observability — the wider set of dashboards.
- Respond to an attack — the playbook that uses this view first.