Observability
Four surfaces cover "what is happening on this panel right now": Dashboard, Security overview, Threats, and Logs. Plus GeoIP enrichment to turn IPs into something you can reason about. Plus two lightweight status pills in the navbar that carry the coarsest read of the panel's current posture.
Navbar status pills
Two small color-coded pills sit inline next to the logo at the top of every page. They are the fastest way to notice a posture change without opening a tab, and both are click-through to the settings page that controls them.
- AppSec pill -- always visible. Three states:
- disabled (slate): the WAF is off, no request filtering.
- detect (amber): the WAF is logging hits but not blocking; mode=detect.
- block (red): the WAF is actively rejecting matches with a 403; mode=block. This is the strongest stance and the pill colour makes it hard to miss.
- LAN mode pill (amber, conditional) -- shown only when the panel is reached from a browser that is not
localhostAND the panel mode islan. Warns the operator that the session cookie is notSecure, HSTS is off, and Browser Push is unavailable from this context.
The two pills replaced the earlier stripe-style banners that ate a row of vertical space under the header. The information density is the same; hover (or tap) a pill for the long-form tooltip, click it to go to the settings page that controls it.
Dashboard
Home tab, entry point. Cards:
- Traffic — requests over the last 24 h, bucketed by hour, with status-class colouring (2xx / 3xx / 4xx / 5xx).
- Security — blocked requests (CrowdSec + WAF + rate-limit) over the same window, with a world map of attacker origins and a top-IPs table.
- Health — DB size, goroutine count, notification queue depth, last backup status, panel uptime.
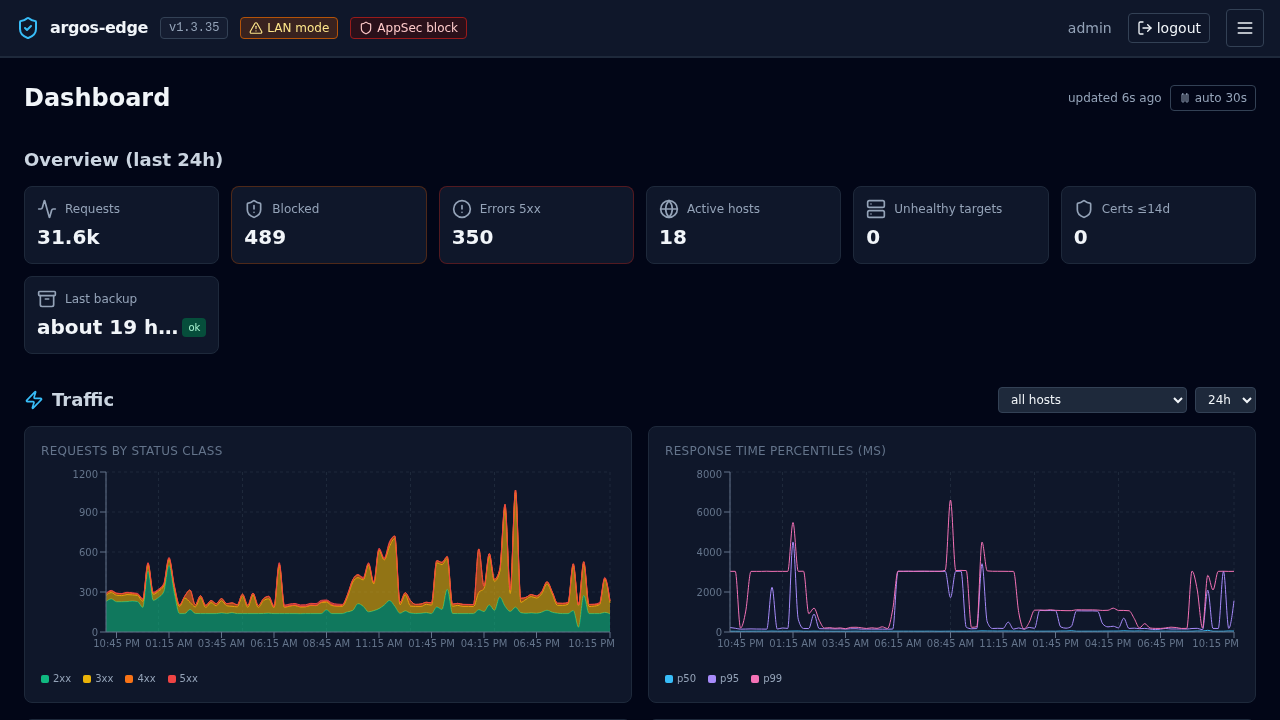
All cards poll /api/dashboard/* on a ~30 s cadence. No SSE.
Security overview
/api/security/overview aggregates the per-host security posture:
- WAF enabled count, mode distribution across hosts.
- Rate-limit enabled count.
- ForwardAuth enabled count.
- Cert expiry stats (expiring soon, renewal recent failures).
Rendered as /security tab. One glance to see which hosts are "on" for each protection layer.
Threats
/threats tab drives the CrowdSec integration. Two sub-tabs:
- Decisions — active LAPI decisions list (IP, scenario, duration, origin). Add / delete via the UI. Full reference: CrowdSec.
- Status + Scenarios — LAPI reachability, enrollment state, installed collections with counts.
Logs
/logs is the workhorse. Three log sources are ingested into log_entries and surfaced through the same filter UI:
| Source | Origin |
|---|---|
caddy_access | Caddy's structured access log. |
caddy_error | Caddy's error log. |
audit | argos' own mutations (config_change, login events, etc.). |
waf_audit | Coraza audit entries. Same table, separate source. |
Filters
Everything is AND together. Supported filters:
source IN (...)host_id IN (...)/host_domain IN (...)— OR-joined so WAF audit rows that only carry host_domain still match.rule_id IN (...)(the argos Rule, not CRS).status—200,4xx,500-504,200,301.method— GET / POST / ...path— substring match, orre:<regex>for regex.remote_ip— substring. CIDR is evaluated at the API edge.level— info / warn / error / ...query— free text, LIKE across path + user_agent + message + raw.waf_rule_id(int) +waf_severity(CRITICAL / ERROR / ...).
Tail
With Live on, the UI opens an SSE stream (GET /api/logs/tail) that pushes new rows as they land. Each row respects the active filter. Click Pause to freeze; the list stays editable while paused.
Stats
Stats sub-tab computes aggregates over the current filter:
- Total, by-status-class distribution, by-source distribution, avg + p95 duration in ms.
- Top 5 host_domain, Top 5 path.
Useful for answering "what are my 5xx-generating endpoints" or "which IP hits me the most".
GeoIP enrichment
Incoming remote_ip values get annotated with country + ASN via the DB-IP Lite databases (CC-BY-licensed free tier). Two mmdb files under /data/geoip/:
country.mmdb— ISO country code + name.asn.mmdb— AS number + org name.
Enrichment is lazy on the API side — /api/geoip/lookup?ip=... returns the annotated record, and the Dashboard + Logs UIs call it for rows they render.
The downloader refreshes both files monthly: hardcoded cron 0 3 5 * * (day 5 at 03:00 UTC, chosen so DB-IP's 1st-of-month publish has warmed CDN edges). Manual refresh: System → GeoIP → Refresh now or POST /api/geoip/refresh.
Private / LAN addresses short-circuit without DB lookup and render as country LAN, ASN 0.
Retention
log_entries has two retention knobs:
logs.retention_days— default 30. Rows older than this are dropped on the retention cron (runs every 6 h, plus once at boot).logs.max_entries— default 500 000. If the retention-by-age pass left more rows than this, the oldest are dropped down to the cap.
Audit rows share the cap. Tight retention on a chatty WAF host can evict audit trails faster than you want; bump the cap or lengthen retention if forensics matter.
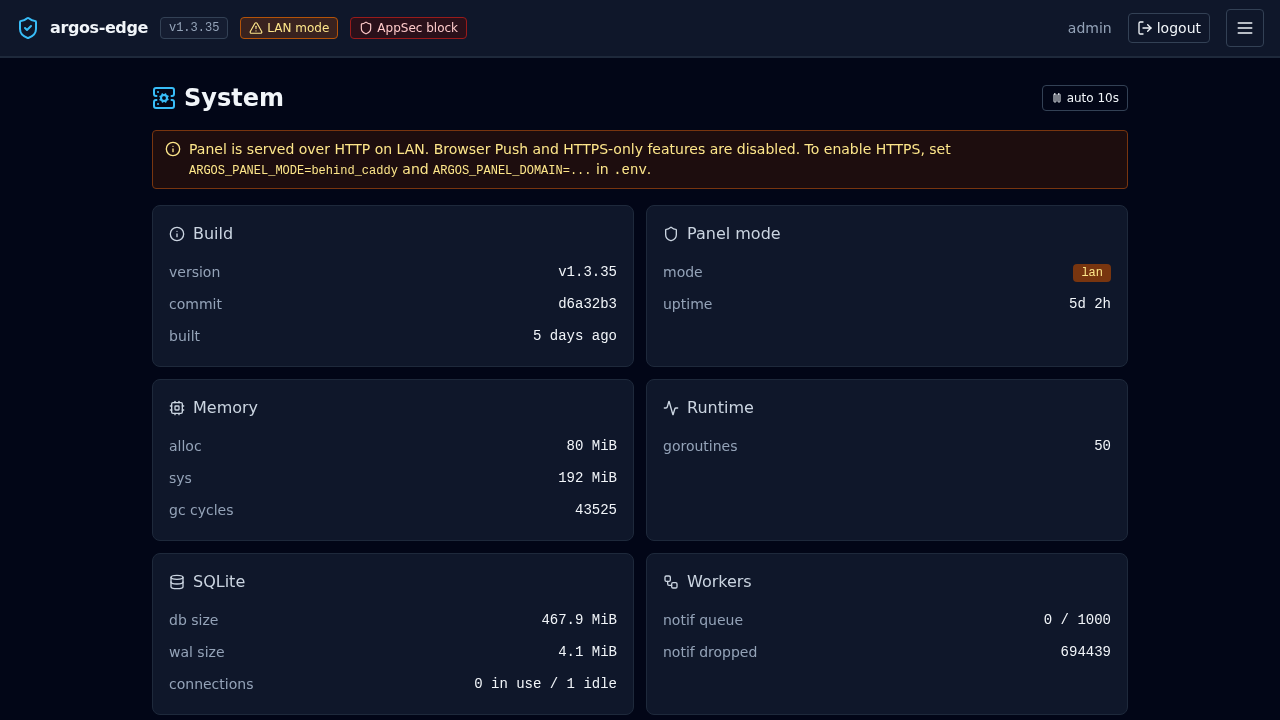
/system/health
The rich one. Not surfaced as a primary UI tab but exposed at GET /api/system/health:
- Memory: Alloc / Sys / GC count.
- Goroutines.
- DB: open connections, idle, in use + file sizes (
argos.dband WAL). - Workers: notification queue depth + capacity + dropped count.
- Scheduler: last backup timestamp + status.
- Panel: mode, domain, uptime seconds.
Wire to an external uptime monitor that alerts on non-200 or on memory.Alloc > X.
What is NOT observable
- No Prometheus endpoint. Metrics are computed on-demand from SQL queries. For external alerting, drive off
/system/healthJSON + the notification webhook channel. - No per-user traffic aggregation. Logs do not carry session ids.
- No trace / span correlation. Single-request ids exist in Caddy's access log but argos does not propagate them into the audit layer.
Related
- Monitoring — day-two posture, what to watch, when to alert.
- Notifications — how observability becomes pings.
- Reference / API — exact endpoint list.