Logs browser
/logs is the single pane for every structured event the panel collects: Caddy access + error logs, WAF audit rows, and the panel's own audit trail. One filter UI, one table, one entry drawer.
For what gets ingested and the retention knobs, see Observability and Settings.
Time range
Quick-range buttons at the top: 15m, 1h, 6h, 24h, 7d. Default is 1h. The range is disabled while Live tail is on (see below) — in that mode you are looking at a sliding window of incoming events, not a query.
Filters
Six fields in a row under the range selector:
| Filter | Accepts |
|---|---|
| search (q) | Free-text match against message + raw body. |
| source | All sources, caddy_access, caddy_error, audit. waf_audit is not in the dropdown but is valid — the preset selector and per-host "Logs" action pass it directly. |
| status | HTTP status codes or classes: 200, 4xx, 200-299, 4xx,5xx. |
| method | GET, POST, or a comma list: GET,POST. |
| path | Literal substring match. Toggle the re checkbox to the right to treat the input as a regex (re: prefix is added for you). |
A Clear filters button appears next to pagination when any field is set.
Filter state is URL-driven: the "Logs" button on the Security overview and the "Trace similar" action in the entry drawer both land you here with filters pre-applied via ?source=...&host_id=....
Presets
The dropdown labelled "Preset..." loads curated filter sets from the backend:
| Preset | Filters |
|---|---|
| All errors | status=4xx,5xx |
| 5xx (last hour) | status=5xx, last 60 min |
| Slow requests | source=caddy_access, hint to filter by duration>1000 client-side |
| Certificate events | source=caddy_error, q=acme |
| Auth events | source=audit, q=login |
| Config changes | source=audit, q=create update delete |
| Blocked requests | source=caddy_access, status=403 |
| WAF blocks | source=waf_audit, waf_severity=CRITICAL,ERROR |
| WAF alerts (24h) | source=waf_audit, last 24 h |
Applying a preset replaces the current filter set and fires a toast so you notice it landed.
Stats strip
Above the table, five cards summarise the current filtered query:
- Total — rows matching.
- 2xx (emerald), 4xx (amber), 5xx (red) — counts by status class.
- avg ms / p95 — aggregate durations across
caddy_accessentries in the result set.
The strip updates with every filter change.
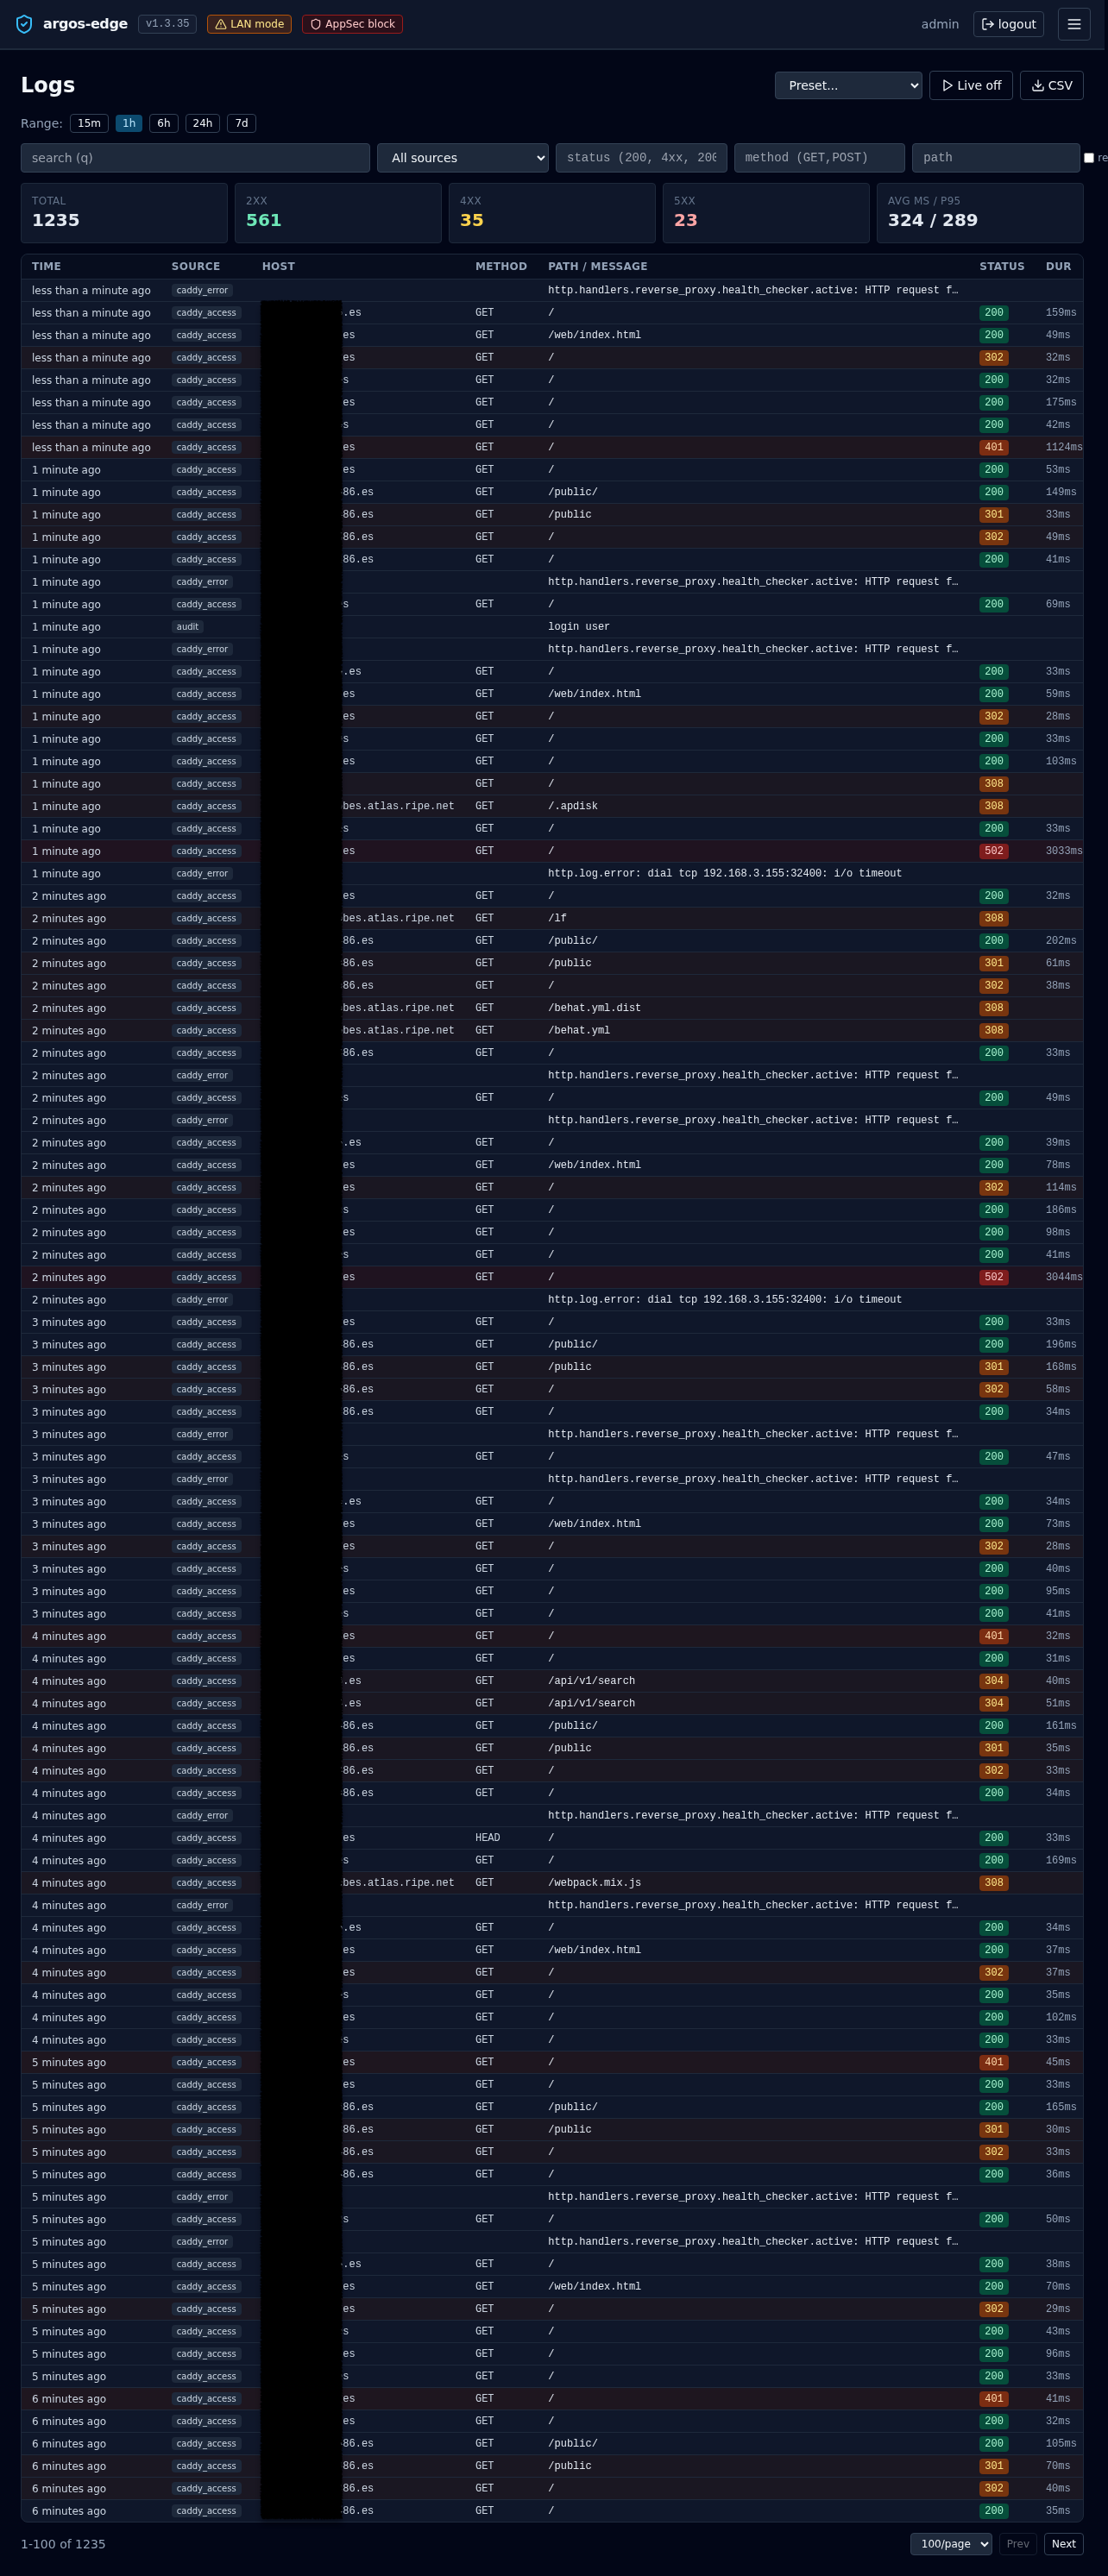
Table
Eight columns, fixed-width on the left so the Path/Message column gets the most horizontal room:
| Column | Notes |
|---|---|
| Time | Relative ("2 minutes ago") for entries within the last 24 h, absolute (YYYY-MM-DD HH:MM:SS) otherwise. Tooltip always shows the absolute time. |
| Source | Small slate badge. |
| Host | Monospace domain, truncated. |
| Method | Monospace. |
| Path / Message | For audit rows, the audit message; everything else, the request path. Truncated at ~500 px. |
| Status | Colour-coded badge (emerald 2xx / amber 3xx / orange 4xx / red 5xx). |
| Dur | <n>ms, access rows only. |
| Remote IP | Monospace. |
Rows tint pink at 5xx, orange at 4xx, amber at 3xx so a wall of red is visible at a scroll. Click any row to open the detail drawer.
Entry drawer
The side drawer renders every non-empty field on the entry plus two affordances:
- GeoIP enrichment — when
remote_ipis public, the drawer fetches/api/geoip/lookupand shows the country flag + name + ASN/org on a sub-row under Remote IP. LAN IPs read as "LAN". See Observability for the GeoIP subsystem. - Raw — the full underlying row as stored, pre-formatted. Useful when diagnosing a parsing bug in the log producer.
Two actions at the bottom:
- Copy raw — copies the raw field (or the serialised entry if raw is empty) to the clipboard.
- Trace similar — reopens the list with filters set to match this entry's
source,status,method,path, andhost_id. Handy when one row of a burst tells you what pattern to hunt for.
Live tail
The Live off button toggles to Live (red pill, radio icon) and opens an EventSource against /api/logs/stream. New entries stream in at the top of the table; history older than 500 rows is dropped from memory to keep the page responsive.
While live:
- The range selector is hidden (live is its own time window).
- CSV export is disabled (the stream is unbounded).
- Current filters still apply server-side — you can live-tail only 5xx, only WAF blocks, only a specific host.
Click Live again to stop. Dedup by entry ID is automatic so a proxy that duplicates events does not double up the view.
CSV export
The CSV button streams /api/logs/export.csv?<current filters> through the browser's download path. Headers match the table columns plus a few WAF-only fields. Use this when you need an incident artifact — the panel does NOT keep logs beyond the retention window configured in Settings, so export before a purge if you want the trail.
Pagination
Below the table: Prev / Next buttons plus a per-page selector (50 / 100 / 200 / 500). The counter on the left reads <start>-<end> of <total> so you always know where you are in the result set.
Related
- Observability — the full observability surface (Dashboard / Security / Threats / Logs / GeoIP).
- Security overview — per-host view that deep-links into this page with
source=waf_audit&host_id=<id>. - Settings — retention, max entries, manual purge.
- WAF — the
waf_auditsource origin.